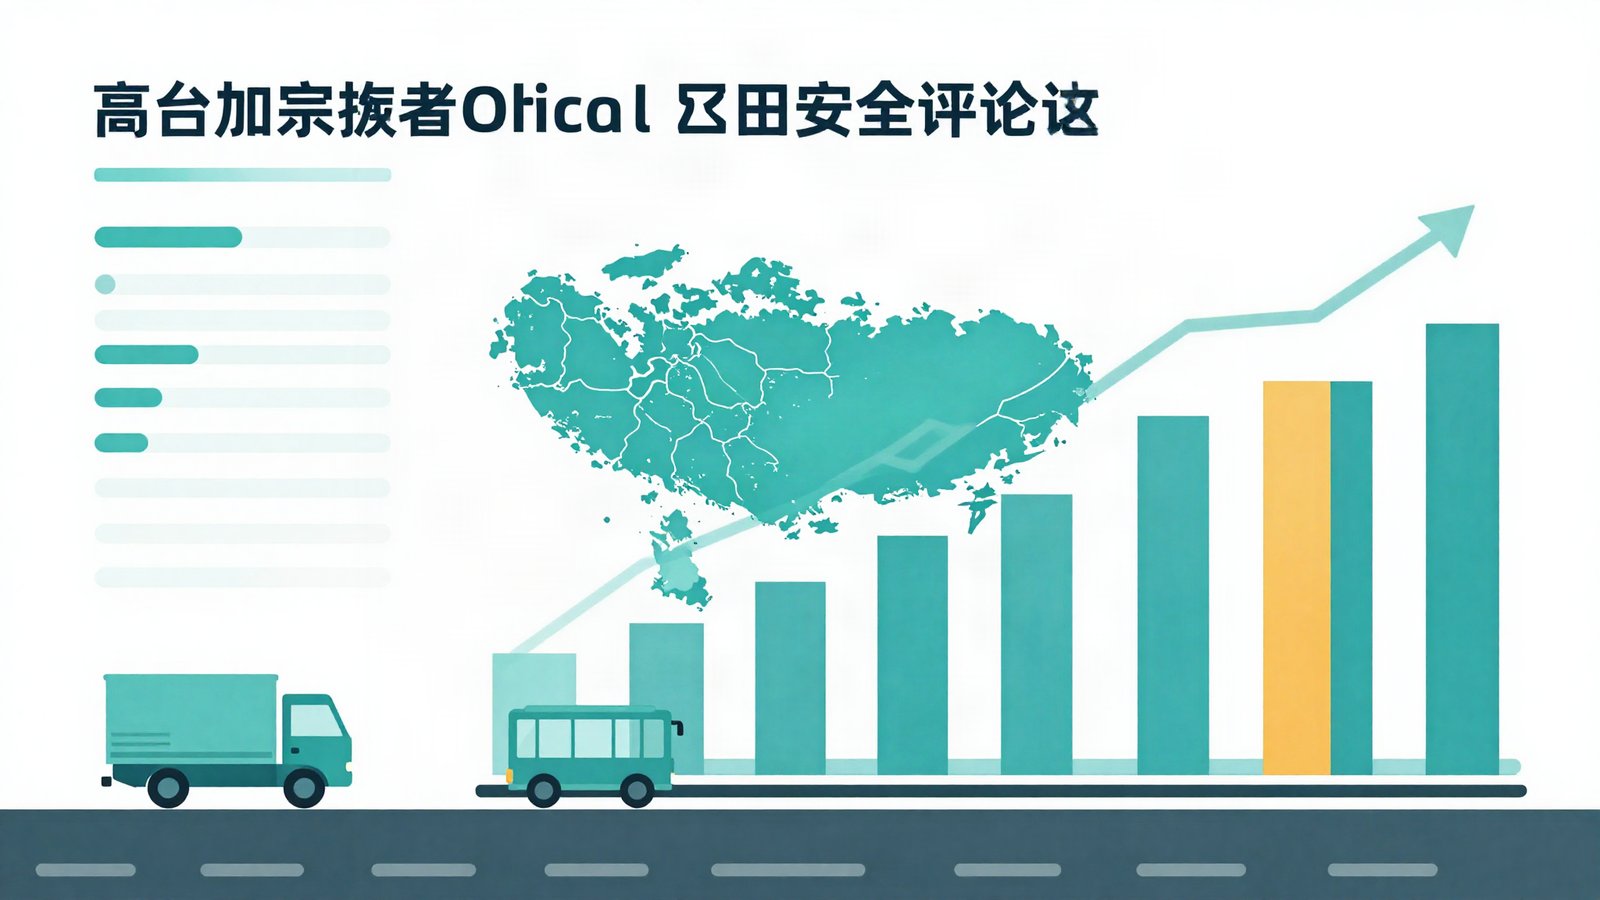
Commercial Vehicle Accident Statistics in Singapore: What Fleet Managers Should Know
Singapore recorded 147 fatal traffic accidents and 149 deaths in 2025, up 4.9% from 142 deaths in 2024, per the Singapore Police Force’s Annual Road Traffic Situation report. Separately, data.gov.sg’s official vehicle-type breakdown shows lorries, goods vans and buses together accounted for 2,369 of the 14,168 vehicles involved in fatal and injury accidents in 2024 — 16.7% of the total, and a rising share. For fleet managers, the takeaway isn’t panic; it’s that the direction of travel on both accident volume and heavy-vehicle involvement is up, and that argues for tighter safety policy now rather than after an incident.
Key Takeaways
- Overall accidents rose again in 2025: 147 fatal accidents (+5.8% from 139 in 2024), 149 fatalities (+4.9%), and 7,560 injury accidents (+7.2%), per SPF’s Annual Road Traffic Situation 2025 report.
- Heavy vehicles are a growing slice of the pie: lorries, tipper trucks, trailers, goods vans and pick-ups and buses combined were involved in 2,369 vehicles-in-accidents in 2024, up from 1,995 in 2022 — a 16.7% share of all vehicles in fatal and injury accidents, up from 16.0% two years earlier (data.gov.sg).
- Lorries are outpacing the overall growth rate: “Lorries, Tipper Trucks & Trailers” involvement climbed from 1,045 (2022) to 1,274 (2024) — a 21.9% rise, faster than the 13.9% rise in total vehicles-in-accidents over the same period.
- The single biggest recorded cause of accidents is a lookout failure, not mechanical fault: SPF attributes 52.0% of 2025 accidents to motorists failing to keep a proper lookout, ahead of inadequate vehicle control (11.0%) and improper lane changing (7.0%).
- Motorcyclists remain the highest-risk group on the road — 53.0% of 2025 fatalities and 54.8% of all accidents involved motorcycles, despite motorcycles being only 15% of the vehicle population. Commercial vehicles share the same roads and junctions with this group constantly.
- SPF does not publish a fatality-by-vehicle-type breakdown in the same detail as accident-involvement counts — a real gap worth knowing about before you go looking for a “goods vehicle fatality rate” that isn’t published in this form.
Singapore’s Road Accident Trend: What SPF’s Own Numbers Show
Start with the headline number, because it sets the context for everything else in this article: Singapore’s road accident situation got worse in 2025, not better. According to the Singapore Police Force’s Annual Road Traffic Situation 2025 report, released in February 2026, there were 147 fatal accidents in 2025, up from 139 in 2024 — a 5.8% increase. Those accidents claimed 149 lives, up 4.9% from 142 the year before. Injury accidents rose 7.2%, from 7,053 to 7,560 cases, and the number of people injured climbed 6.6%, from 9,342 to 9,955.
This isn’t a one-year blip. The 2024 report told a similar story a year earlier: fatal accidents rose 6.1% from 131 (2023) to 139 (2024), fatalities rose 4.4% from 136 to 142, and the fatality rate per 100,000 population ticked up from 2.30 to 2.35. Two consecutive annual reports showing accidents, fatalities and injuries all moving in the same direction is the kind of pattern that should get a fleet manager’s attention, independent of what specific vehicle types are involved.
SPF’s own breakdown of root causes is worth sitting with. In the 2025 report, “failure to keep a proper lookout” was cited as the cause in 52.0% of accidents — by far the largest single category, ahead of inadequate vehicle control (11.0%) and improper lane changing (7.0%). The 2024 report described the same top three causes in narrative form: failure to keep a proper lookout, lack of adequate vehicle control, and lane changing without due care. In other words, across two consecutive years, more than half of Singapore’s road accidents trace back to a driver simply not seeing what was there to be seen — not to mechanical failure, not to weather, not to road design. That single fact should shape how any fleet manager thinks about training and monitoring priorities, commercial vehicles included.
Enforcement data adds texture. Speeding violations detected by cameras and enforcement surged from 201,358 in 2024 to 253,550 in 2025 (+25.9%), even as speeding-related accidents fell slightly, from 547 to 515 cases. Red-light violations fell 14.1% (29,652 to 25,462) yet red-light-running accidents rose 27.1% (96 to 122) — a reminder that violation counts and accident counts don’t always move together, and neither should be read in isolation.
Where Do Commercial and Heavy Vehicles Fit In?
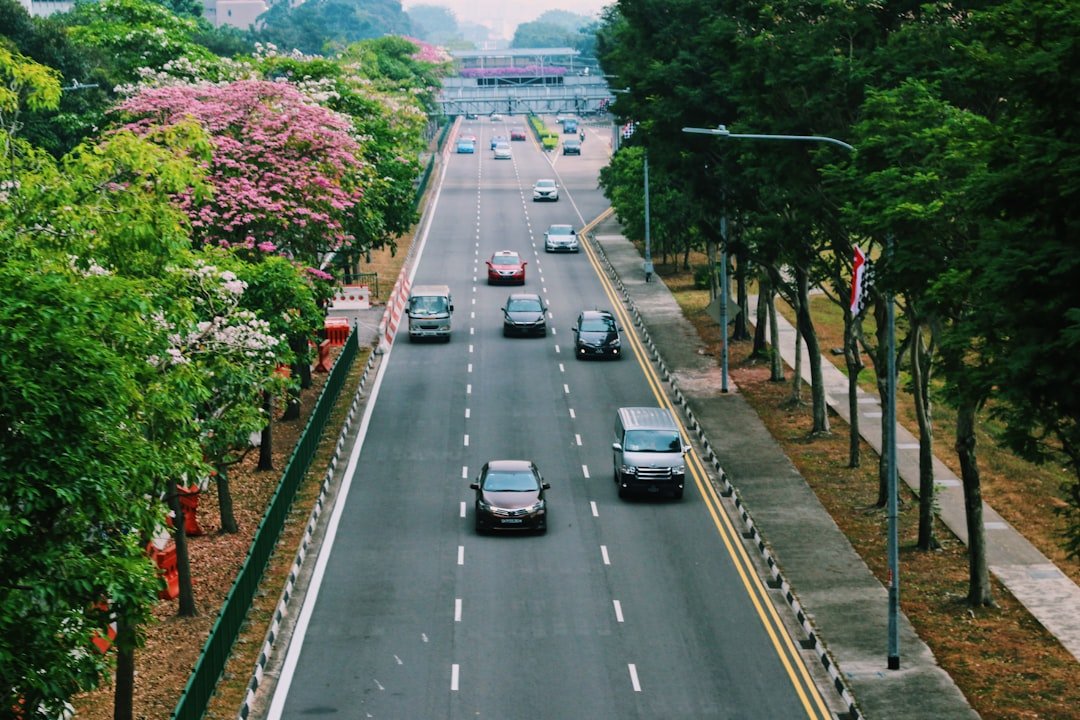
SPF’s annual news releases focus on overall trends, motorcyclists and elderly pedestrians — the groups driving the largest share of fatalities — and don’t break fatalities down by vehicle type in the press materials. For a fleet-specific view, the more useful source is data.gov.sg’s dataset “Vehicles Involved In Road Traffic Accidents (Fatal And Injury) By Type Of Vehicle, Annual,” compiled from SPF data and covering January 2015 to December 2024. It counts every vehicle involved in a fatal or injury accident, by category, each year — which is a count of involvement, not a count of fault or a fatality rate, and that distinction matters when you’re reading it.
Here’s what the three most recent years on record show for the categories a fleet manager actually cares about:
Vehicles involved in fatal and injury accidents, by type
- 2022: Total 12,435 vehicles. Lorries, Tipper Trucks & Trailers: 1,045. Goods Vans & Pick-Ups: 568. Buses: 382. Combined heavy/commercial: 1,995 (16.0% of total).
- 2023: Total 13,507 vehicles. Lorries, Tipper Trucks & Trailers: 1,131. Goods Vans & Pick-Ups: 689. Buses: 387. Combined: 2,207 (16.3% of total).
- 2024: Total 14,168 vehicles. Lorries, Tipper Trucks & Trailers: 1,274. Goods Vans & Pick-Ups: 655. Buses: 440. Combined: 2,369 (16.7% of total).
Two things stand out. First, roughly one in six vehicles involved in a fatal or injury accident in Singapore in any of the last three years was a lorry, goods van, pick-up or bus — a meaningfully large share for a vehicle category that makes up a much smaller slice of the overall vehicle population. Second, that share has been drifting upward, not down: 16.0% in 2022 to 16.7% in 2024. The lorry category alone grew 21.9% over those two years (1,045 to 1,274), outpacing the 13.9% growth in total vehicles-in-accidents over the same period. Goods vans and pick-ups grew 15.3% (568 to 655); buses grew 15.2% (382 to 440).
None of this proves commercial vehicles are becoming more dangerous per kilometre driven — the dataset doesn’t include exposure data (total distance travelled by category), so a rising count could partly reflect a growing goods-vehicle and delivery fleet on Singapore’s roads rather than a rising per-vehicle risk. But for a fleet manager, the practical reading is straightforward: your vehicle category’s raw involvement in accidents is trending up, in absolute terms, in the most recent published data. That’s a fact worth acting on regardless of what’s driving the denominator.
Being upfront about the data gap: neither SPF’s Annual Road Traffic Situation press releases nor the data.gov.sg vehicle-type dataset publish a fatality count specifically attributed to goods vehicles, lorries or buses, nor an accident rate per vehicle-kilometre by category. What’s verifiably available is vehicle-involvement counts (above) and overall fatality/injury trends. We’re not going to manufacture a “goods vehicle fatality rate” to make this article sound more dramatic — if LTA or SPF publishes that breakdown in a future report, we’ll update this page.
Common Contributing Factors in Commercial Vehicle Accidents
Setting aside Singapore-specific statistics that aren’t publicly broken out, road safety research and incident-investigation practice generally point to a recurring handful of contributing factors specific to commercial and heavy vehicles. These are widely recognised risk factors in the fleet and logistics sector, not claims about Singapore-specific accident causation data — treat them as a framework for what to check in your own operation, not a citation of local statistics.
Fatigue
Commercial drivers — especially those on multi-stop delivery routes, night shifts, or long-haul cross-causeway work — are exposed to fatigue in a way private motorists typically aren’t. Fatigue degrades reaction time and attention in ways that overlap directly with SPF’s top accident cause, “failure to keep a proper lookout.” Rest-hour compliance and realistic scheduling are the standard mitigations.
Blind spots
Lorries and buses have substantially larger blind spots than cars, particularly to the nearside and directly behind the vehicle. Motorcyclists and cyclists — who, per SPF’s own data, make up more than half of all accident involvement and fatalities in Singapore — are disproportionately vulnerable in exactly these blind zones, especially at junctions and during lane changes.
Turning incidents
Left- and right-turn manoeuvres at junctions are a recognised high-risk moment for heavy vehicles interacting with pedestrians, cyclists and motorcyclists who may be in a blind spot or misjudge how wide a turning radius a long vehicle needs. This is a standard focus area in commercial driver training internationally, and it aligns with SPF’s finding that improper lane changing and lookout failures dominate accident causation generally.
Loading-related instability
Uneven, unsecured, or excessive loads shift a vehicle’s centre of gravity and braking behaviour, increasing rollover and jackknife risk — particularly on the tighter curves and ramps common in Singapore’s expressway network and industrial estates. This is a mechanical and procedural risk factor, not a driver-behaviour one, which is why pre-trip load checks belong in a written safety policy rather than left to driver discretion.
What This Data Means Practically for a Fleet Manager
Further reading: If an incident has occurred, see how commercial-vehicle NCD works after an at-fault accident.
Put the two data sets together and the practical read is this: overall accidents in Singapore are trending up for at least two consecutive reporting years, heavy and commercial vehicles’ share of that accident involvement is also trending up, and the single largest documented cause — lookout failure — is exactly the kind of risk that structured fleet management can reduce. None of that requires alarmism. It requires a policy response sized to the actual trend.
A few concrete places to start:
Written safety policy, reviewed against real incidents. If your fleet doesn’t have a documented safety policy covering rest hours, pre-trip checks, load securing and turning procedures, the rising accident and heavy-vehicle-involvement trend is a reasonable trigger to build one — and to tie it to driver compliance obligations rather than treating it as a nice-to-have. Our guide to MOM driver compliance in Singapore covers the regulatory side of rest hours and working-time rules that a fatigue policy needs to sit on top of.
Driver training targeted at the documented failure mode. Given that “failure to keep a proper lookout” accounts for more than half of accidents in SPF’s own figures, training spend is best directed at hazard perception, blind-spot awareness around motorcyclists and cyclists, and turning discipline — not generic defensive-driving content that doesn’t map to the actual cause profile.
Telematics and dashcam monitoring, used for coaching rather than punishment. Harsh-braking, lane-departure and blind-spot-incursion data from telematics systems gives a fleet manager an evidence base for exactly the risk factors above — fatigue-adjacent driving patterns, near-miss turning events, unsafe following distance around two-wheelers — well before they become an accident statistic. This only works if it’s positioned to drivers as a coaching tool, not surveillance for its own sake; fleets that get this wrong see higher driver turnover with no safety benefit.
Vehicle condition and load management. Loading-related instability and inadequate vehicle control (SPF’s second-largest cause category, at 11.0% in 2025) both point back to maintenance and pre-trip inspection discipline. Regular, documented servicing through a properly equipped workshop reduces the mechanical half of that risk; see our overview of MRO workshops for commercial vehicles in Singapore for what a maintenance programme should cover.
Insurance implications. A rising accident trend at the national level, combined with your own fleet’s claims history, is exactly what insurers price against at renewal. Fleet managers who can point to a documented safety policy, driver training records and telematics data typically have a stronger negotiating position than those who can’t — our guide to commercial vehicle insurance in Singapore goes into how insurers actually assess fleet risk.
The honest summary: the data doesn’t show that Singapore’s commercial vehicles are uniquely dangerous, and it would be irresponsible to claim it does when the published statistics don’t break fatalities down that way. What the data does show — reliably, from SPF’s own reports and data.gov.sg’s own dataset — is that accidents are increasing nationally, and that heavy and commercial vehicles’ involvement in those accidents is increasing too, in both absolute numbers and share of total. That’s a reasonable, evidence-based case for tightening fleet safety practice now, and a much better basis for a decision than either ignoring the trend or overstating it.
FAQ
How many road traffic deaths were there in Singapore in 2025?
149 people died in road traffic accidents in Singapore in 2025, across 147 fatal accidents, according to SPF’s Annual Road Traffic Situation 2025 report. That’s up from 142 fatalities across 139 fatal accidents in 2024 — a 4.9% rise in deaths year on year.
What percentage of Singapore’s road accidents involve goods vehicles or lorries?
Based on data.gov.sg’s vehicle-type dataset, lorries, tipper trucks and trailers accounted for 1,274 of 14,168 vehicles involved in fatal and injury accidents in 2024 (9.0%). Add goods vans and pick-ups (655, or 4.6%) and buses (440, or 3.1%), and heavy/commercial vehicles combined made up 16.7% of all vehicles involved in fatal and injury accidents that year.
Is Singapore’s road accident rate getting better or worse?
Worse, on the two most recent years of published data. Fatal accidents, fatalities and injury accidents all increased from 2023 to 2024 and again from 2024 to 2025, per SPF’s Annual Road Traffic Situation reports for those years.
What causes the most road accidents in Singapore?
Failure to keep a proper lookout, which SPF attributed to 52.0% of accidents in 2025, followed by inadequate vehicle control (11.0%) and improper lane changing (7.0%). This has been the consistent top cause category across the 2024 and 2025 reports.
Does SPF publish fatality data specifically for goods vehicles or buses?
Not in the same level of detail as its overall and motorcyclist/pedestrian breakdowns. The publicly available goods-vehicle and bus figures are accident-involvement counts from data.gov.sg, not a fatality rate or fault attribution by vehicle type. We’ve flagged this gap rather than filling it with an invented number.
What should a fleet manager actually do with this data?
Use it to prioritise, not panic. The data supports focusing training on lookout and blind-spot awareness, tightening rest-hour and pre-trip inspection compliance, adopting telematics/dashcam monitoring as a coaching tool, and reviewing insurance positioning — each addressed in more detail in the sections and linked guides above.
Author: Keith Kwai, editor and publisher of SGFleetGuide, with 25 years experience in B2B and B2C companies. More about the author.
Last updated: 11 September 2026
Sources: Singapore Police Force, Annual Road Traffic Situation 2025 and Annual Road Traffic Situation 2024 news releases; data.gov.sg, “Vehicles Involved In Road Traffic Accidents (Fatal And Injury) By Type Of Vehicle, Annual” dataset (SPF/SingStat, Jan 2015–Dec 2024).



One Comment